A team from the Center for Communicable Disease Dynamics at the Harvard T.H. Chan School of Public Health has designed an app to explore how many COVID-19 cases may exist in areas without widespread testing.
The app lets users adjust various parameters, which are then used by the model to estimate how many cases might be circulating given those parameters (in places without widespread testing).
[Github here.]
The authors of the model caution that some scenarios may be unrealistic and the model is for exploration only.
From the authors:
-
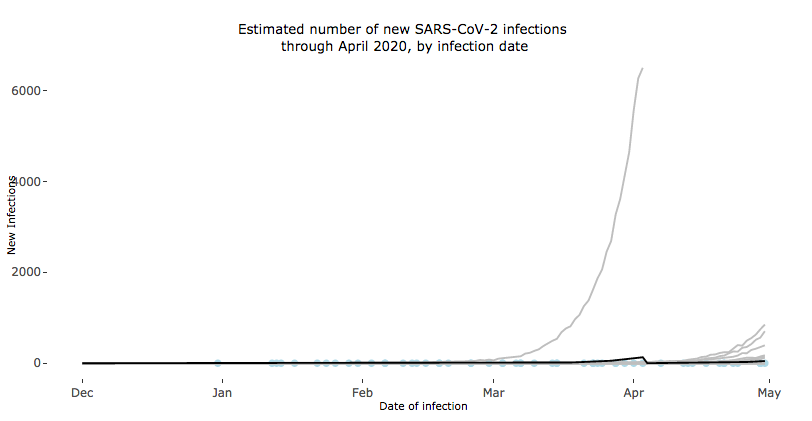
We calibrated timing of introductions of infected persons into a city based on an epidemic curve with exponential growth beginning on December 1 (based on genomics data, SARS-CoV-2 was estimated to have been first introduced into the human population sometime in November or early December 2019) and then leveling off on January 23 (when travel restrictions were implemented in Wuhan) to account for decreased travel from Wuhan but to allow for continued introductions from elsewhere. Light blue dots along the x-axis show dates of introductions. We then modeled the subsequent transmission chains stemming from those introductions.
-
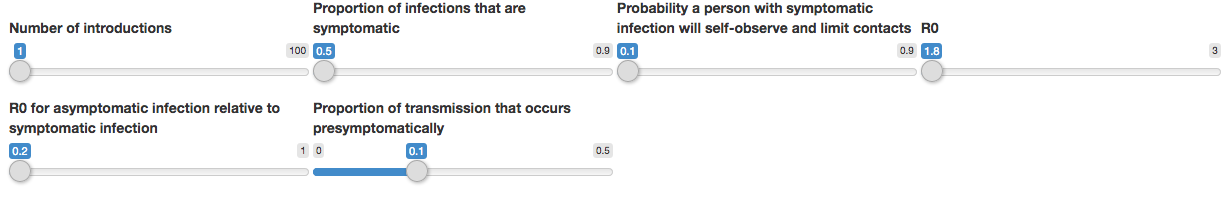
We varied parameters for number of expected introductions, proportion of infections that are symptomatic, probability a person with a symptomatic infection will self-observe and limit contacts, R0, R0 for asymptomatic infection relative to symptomatic infection, and proportion of transmission that occurs presymptomatically. Change the inputs on the bars below to see how these affect the outbreak trajectories.
-
The y axis shows the number of either new or cumulative infections in a city, which are a combination of imported infections and their subsequent infections. Results are shown for 5 months.